Setup Tab
The Data Acquisition and Channel Setup tab (the "Setup" tab) is the first/leftmost tab at the top of the screen. It is where you change all the hardware-related settings. These are the settings that cannot be changed once you have started logging, or during analysis. Some of these settings are channel-dependent. For convenience (because this is the only table of settings with one row per channel), the channel-dependent plot settings are also included here. These plot settings can be changed during logging or post-processing. They are an array of check boxes to turn plotting on and off for each channel. The Setup tab is divided into 3 sections:
Main Settings
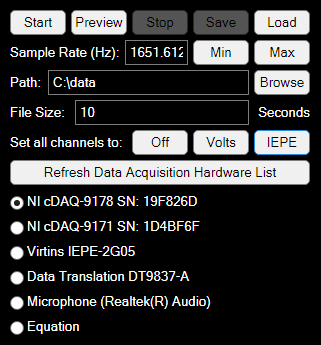
Start: acquire data, log to disk, and plot as requested. Each time you start logging, a new folder is created, containing one setup file and multiple data files.
Preview: acquire data and plot as requested, but do not log to disk. We advise against using this option for investigative work, unless you have disk space limitations (which is unlikely). It is easier to ignore unused data than make up for missing data. There is a risk of an important 'one-off' event happening that you cannot reproduce, or for which there are clues in the measured data on how to reproduce. For similar reasons Expert does not currently offer any kind of 'triggered' measurements. These require additional effort to set up and create the risk of missing important data, for little benefit.
Stop: stop acquiring data
Save: not currently used, but will be plugged in in future releases to save updated plot settings during logging and analysis.
Load: load logged data. We recommend selecting a folder. Selecting a setup file will achieve the same thing. You can also select a subset of the measured data files within the folder.
Sample Rate (Hz): Sample rate in Hz. If you have received VCAT training and are primarily familiar with route-based data logging, this approach to setting up the logger may be unfamiliar to you. See FFT Setup for more information.
Path: Where the data is stored. See Installation for information on the default path and how to change it.
File Size: File size in seconds.
Set all channels to: This is a shortcut to turn all channels off, or to Voltage or IEPE measurements. Some of these buttons may be disabled. For example the Virtins DAQ can only measure in IEPE mode, not voltage.
Refresh Data Acquisition Hardware List: Use this button if you plug in the hardware after starting the software, add or remove an NI module to the carrier, for troubleshooting hardware connectivity, and also as a general reset button. For example, pressing this button in analysis mode cancels analysis and returns you to wait mode. See User Interface for an explanation of different modes. This button may also fix any apparent bugs with the display graphics.
DAQ list radio buttons: All recognised hardware will be listed here. See the Home Page for the latest list of recognised hardware. Note that an NI carrier requires a recognised module before it is added to the list. Only one device can be selected.
Interactive Diagram


In the interactive diagram, click on a channel to cycle between IEPE mode (default, cyan background), off (X) and voltage mode (white background). Voltage measurements are not available for the Virtins DAQ.
This functionality is duplicated in the table.
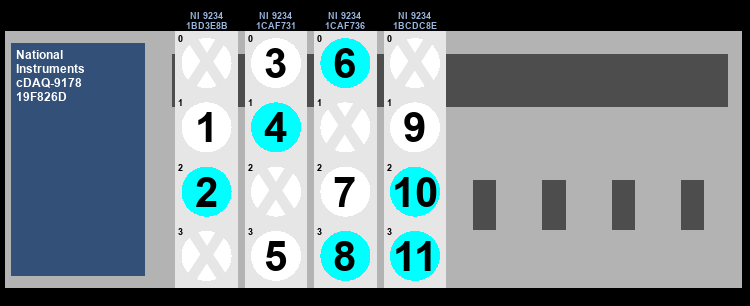
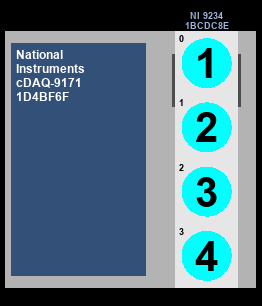
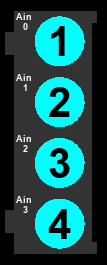
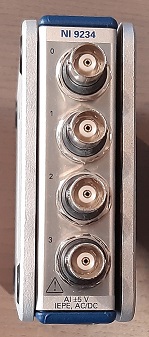
Expert employs a unique channel numbering strategy. Our philosophy here is that for analysis purposes, the hardware can be treated as a black box. Thus the simplest possible numbering system is employed: a 1 based system in which unused channels are ignored. At the same time, for transparency, a record of which channels are actually used is kept. It is displayed in both logging and analysis mode, though it cannot be modified once logging has started or during analysis. The visual display is included for easy comparison with the physical hardware, with cues for orientation. For NI hardware, the serial numbers of both the carrier and the modules are displayed. Think of this as a free record keeping tool for when each piece of your hardware was last used. The NI 9171 carrier diagram differs slightly from the physical device, in order to be consistent with the NI9174 and NI9178 diagrams. At the time of writing, Expert had not been tested with a NI9174 carrier.
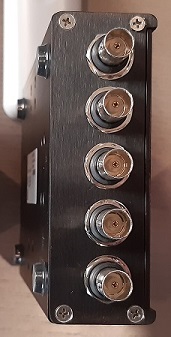
Free advice: Keep careful, detailed, organised, dense (all on one page), time-stamped, written notes of each channel setup and sensor locations. Duplicate this by taking photos of the DAQ hardware (showing the BNC plugs) and sensors. Take plenty of zoomed out photos to help you remember sensor locations. Tag both ends of your cables visually with a colour code, for example, small coloured zip ties and/or heat shrink. Include the colour codes in your notes. This way, your photos double as a redundant record of which sensors/measurement locations are connected to which channels. Written tags hanging from a cable are less useful for this because they are rarely captured properly in a photo, tend to snag, and may need to be updated regularly. You will be surprised how often there is an error or ambiguity in your written notes than can be resolved with a good set of photos.
Be systematic and predictable with your measurement locations whenever possible, so that even if you lose all your notes and records you may still be able to use your data. For example, always measure horizontal, vertical and axial in the same channel order, and develop a default order for measuring machine components. Also, be systematic with you cable tags, so when you are using long cables and you cannot see your DAQ hardware, you can recall which channel you are holding by referring to the tag. If you are using large numbers of long cables, they will tangle. Bundle them into groups of four by taping the first 2/3 of their length with electrical tape (zip ties will snag). Groups of four are convenient because they match the typical groupings on the hardware, giving you additional cues to channel number when you cannot see your DAQ. These strategies combined will reduce the likelihood of errors and ambiguities in your records, speed up the process of resolving them when they do occur, and reduce your stress levels.
Channel Table
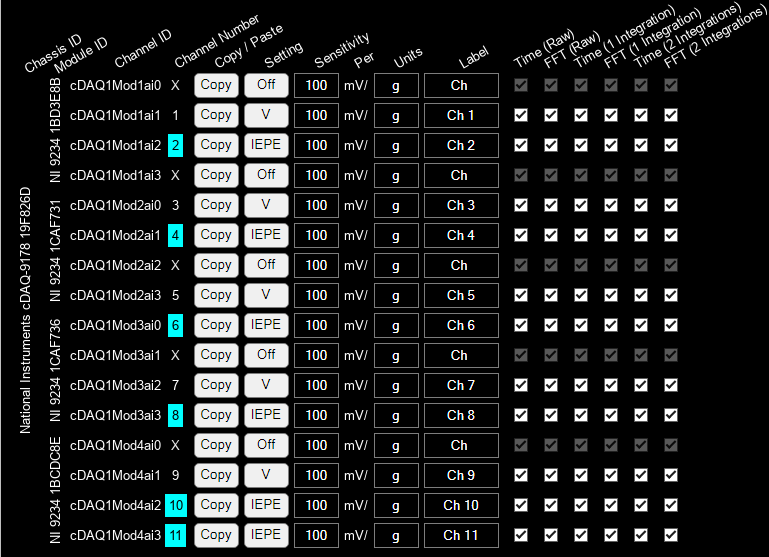
A lot of the information and functionality in the interactive diagram is duplicated in the channel table. For NI hardware, the chassis and module model and serial numbers are in the far left columns. The rest of the table contains one row per channel, including:
Channel ID: as defined by the hardware manufacturer, if available.
Channel number: as used in analysis. An X indicates an unused channel, and cyan background indicates an IEPE channel.
Copy/Paste: copies and or pastes all available channel settings. The numbering in the Label column gets updated when you paste, so that the number matches the channel number.
Setting: click on this to cycle through available channel settings: IEPE, off and voltage (V).
Sensitivity: only a number is entered here.
(Engineering) Units: entering 100 in the sensitivity column and g in the units column gives you a sensitivity of 100 mV/g. If you use g as a unit, it will automatically update to mm/s and mm when integrated.
Label: used as the y axis label when plotting a single channel, or in the legend for plotting multiple channels on one plot.
Checkboxes: use these to turn individual channels off for plotting. The columns shown will change depending on the plot options you select on the options tab (right).