Options Tab Right Panel
The figure below shows the first few rows of the right hand panel of the options tab. The first row of check boxes allows you to turn on or off the 6 main plot types:
- Time waveform of raw data (eg acceleration or noise)
- FFT of raw data
- Time waveform of integrated data (eg velocity data from acceleration)
- FFT of integrated data
- Time waveform of twice integrated data (eg displacement data from acceleration)
- FFT of twice integrated data
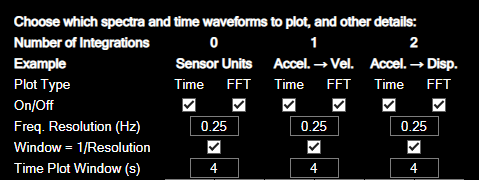
The next three rows show the frequency (bin) resolution for ffts, the time waveform duration used in analysis mode, and a button to link these. If they are linked, the frequency resolution will be the inverse of the time waveform duration, and the data shown in the time waveform plot will be the data that is used to calculate the FFT (see FFT Setup for a detailed explanation). In analysis mode, all of the time waveform data is shown, however you can still show the time window for the current FFT by disabling the peak hold and average spectra and turning on Plot Zoomed Time.
The six columns below this contain (in a rough sense) the options for each of these six plot types. By default, if you turn one of these plot types on, it will be enabled for all acceleration channels (with units of g), or all channels in the case of raw data. You can turn off individual channels on the setup tab. Any options that are not currently available (for example because you are in analysis or acquisition mode) will be greyed out and inactive.
The figure below shows 3 copies of the entire right panel, showing how the options are grouped:
- Red: Raw data.
- Green: integrated data
- Blue: twice integrated data
- Yellow: time waveform plot options
- Purple: FFT plot options.
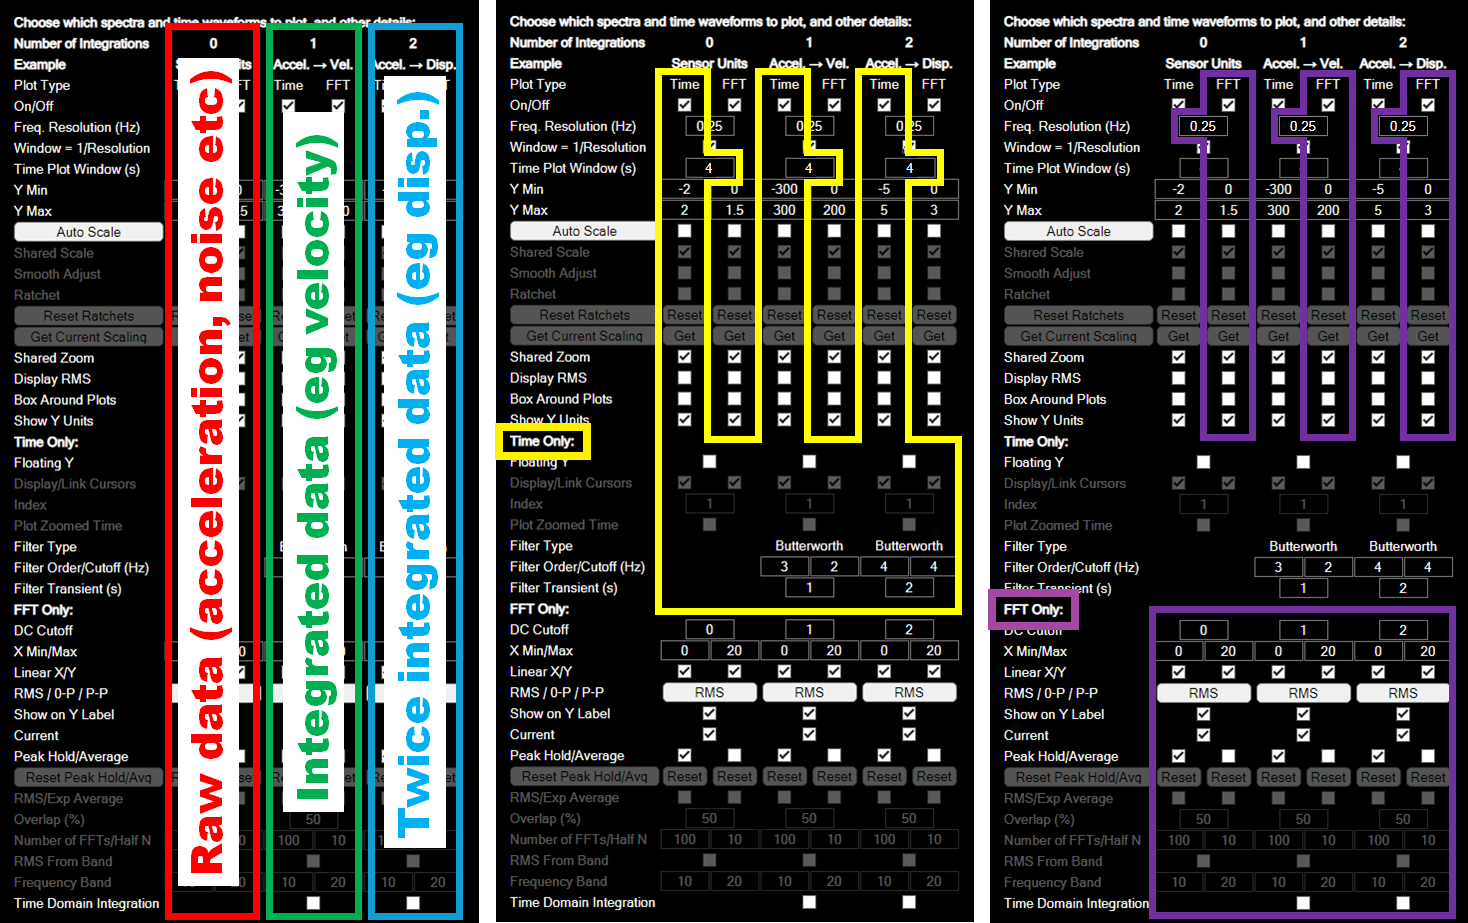
Detailed information on each option is provided below.
Common Options
On/Off: Turns the six plot types on or off for all channels.
Freq. Resolution (Hz):
Window = 1/Resolution:
Time Plot Window (s):
Y Min:
Y Max:
Auto Scale:
Shared Scale:
Smooth Adjust:
Ratchet:
Reset Ratchets:
Get Current Scaling:
Shared Zoom:
Display RMS:
Box Around Plots:
Show Y Units:
Time Waveform Options
Floating Y:
Display/Link Cursors:
Index:
Plot Zoomed Time:
Filter Type:
Filter Order/Cutoff (Hz):
Filter Transient (s):
FFT Options
DC Cutoff:
X Min/Max:
Linear X/Y:
RMS / 0-P / P-P:
Show on Y Label:
Current:
Peak Hold/Average:
Reset Peak Hold/Avg:
RMS/Exp Average:
Overlap (%):
Number of FFTs/Half N:
RMS From Band:
Frequency Band:
Time Domain Integration: