Options Tab Left Panel
In the Plot Options ("Options") tab, there are two panels. The left panel contains layout and arrangement options, while the right panel is used to control what is plotted (eg spectra and time waveforms).
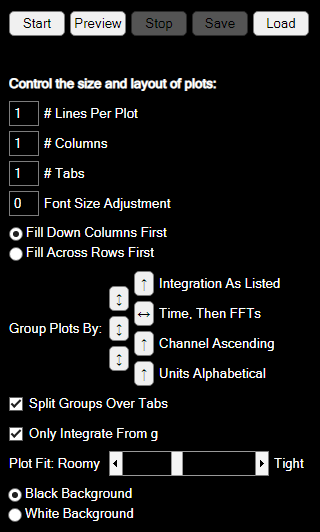
In the left panel, the first row of five buttons is identical to the main Main Settings panel. It is duplicated here so that you do not have to change tabs to start logging.
# Lines Per Plot: This is usually the number of channels on each plot. The exception is spectra with multiple lines per channel. You can plot the current, peak hold and average FFT. For a given channel, they will all appear on the same plot. That is, if you turn all 3 options on and request 1 line per plot, you will still get 3 lines on your FFT.
# Columns: the number of plots across the width of the tab.
# Tabs: use this if the plots look to crowded on one tab, or your computer slows down too much.
Font size adjustment: can be a positive or negative number.
If you select "Fill Down Columns First" and you have 10 plots over 2 columns, the first 5 plots will be in the left column. The alternative is to have the first two plots on the top left and top right.
Group Plots By: This is the confucius pyramid, also known as the feature funnel. Using the default settings as shown above, the first plot will be channel 1 acceleration time waveform (g), followed by the channels in sequence. Any noise measurements will come after acceleration if their units are Pa. Out of the 7 buttons down the middle, the 4 on the right will reverse the order: displacement then velocity and acceleration, FFTs before time waveforms, last channel first, and Pa before g. The 3 left buttons flip the pair to the right. For example, the top one will swap "Time, Then FFTs" with "integration As Listed". This would cause all the time waveform plots to come first - acceleration, velocity and displacement. Test it out and it will make sense eventually.
Split Groups Over Tabs: If this is unticked, you will get roughly the same number of plots on each tab (if you have two or more tabs). If it is ticked, Expert will try to keep groups of similar plots together, for example all the acceleration plots on the first tab and all the velocity plots on the second tab.
Only integrate from g: Tick this if, for example, you do not want to integrate your noise measurements. Note that Expert will use mm/s for velocity plots if the units are g. Otherwise, it will remove a "/s" or add a ".s" to the units for each integration step.
Plot Fit: Roomy / Tight. Slide to the right to leave no space between plots. Slide to the left to leave plenty of room for axis labels.
Black/White background: the choice is yours.